17 May 2026
Unpacking Preflop Range Construction Through Opponent HUD Data Patterns in Online Ring Games
Online ring games rely on heads-up displays that track opponent tendencies in real time, and these tools shape how players build preflop ranges. Data from platforms active in May 2026 shows steady growth in HUD adoption across major sites, with software updates improving stat accuracy and filtering options. Observers note that ranges constructed this way differ sharply from static charts because they respond directly to observed frequencies rather than theoretical defaults.
Core HUD Metrics That Feed Range Decisions
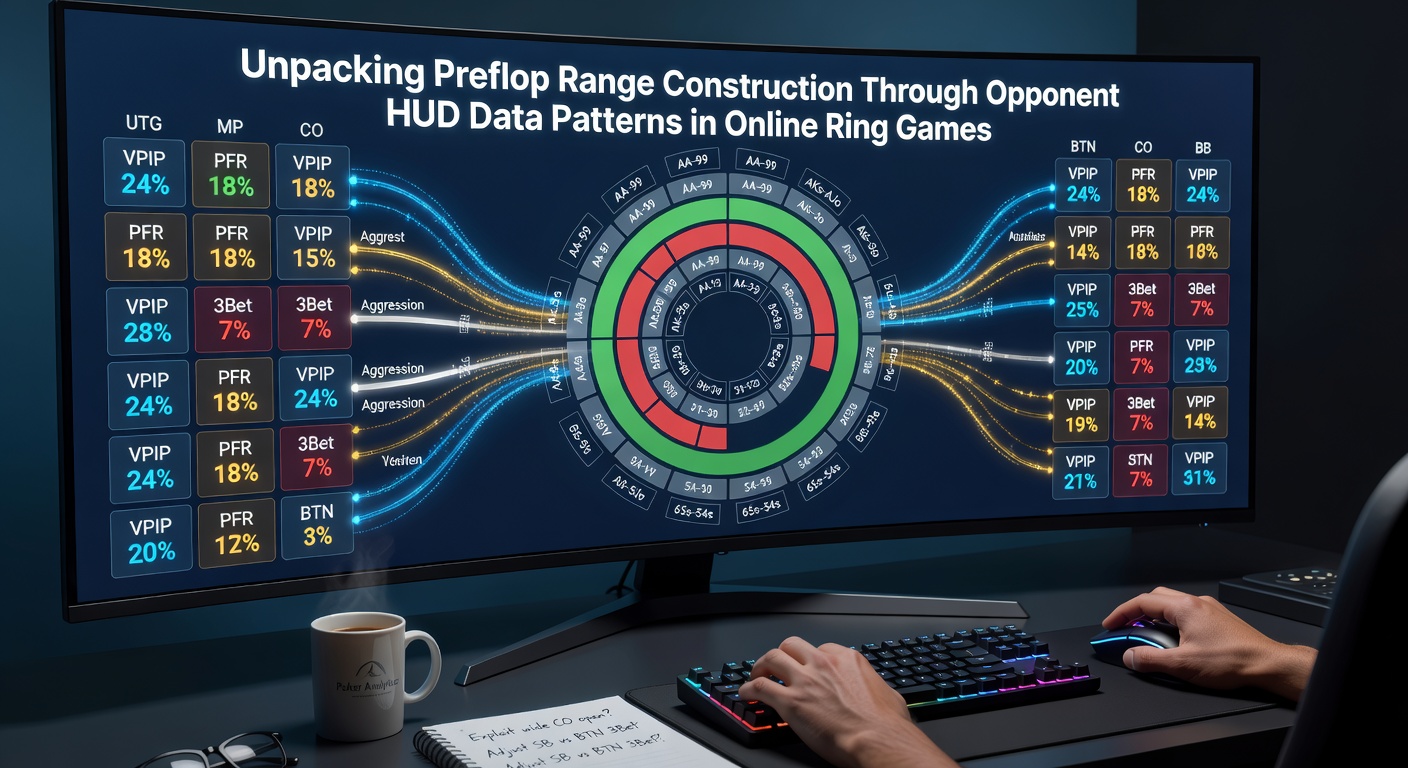
Voluntarily put in pot and preflop raise percentages form the foundation for initial range estimates, while three-bet and fold-to-three-bet numbers refine those estimates further. Players combine these figures with positional data to separate opening ranges from calling ranges and from three-betting ranges. Research from university studies on decision-making under uncertainty indicates that consistent patterns emerge when sample sizes exceed several hundred hands per opponent.
Additional columns track steal percentages from the cutoff and button, along with fold-to-steal rates in the blinds. These secondary stats allow construction of polarized three-bet ranges against frequent stealers and merged ranges against tighter opponents. Data shows that ranges narrow dramatically once an opponent’s VPIP drops below 18 percent over a thousand-hand sample.
Adjusting Opening Ranges Based on Observed Patterns
When HUD numbers reveal a 22 percent VPIP paired with a 16 percent PFR, the player in question opens roughly the top 16 percent of hands yet defends only a modest portion after facing raises. Those who study these patterns often widen their own three-bet range slightly against such profiles while tightening calling ranges to avoid dominated situations. In contrast, an opponent posting a 32 percent VPIP and 24 percent PFR invites wider defending ranges because the initial opening range already contains many medium-strength holdings.
Positional filters matter because the same raw percentages produce different range shapes depending on seat. A high PFR from early position signals much greater strength than an identical number from the cutoff. Analysts tracking May 2026 traffic patterns across European and North American sites report that positional adjustments improve expected value more than raw frequency adjustments alone.
Three-Bet and Four-Bet Range Construction
HUD three-bet statistics guide whether to construct linear or polarized responses. Against a 9 percent three-bet rate that includes both value and bluffs, defenders typically continue with a merged range that includes suited connectors and medium pairs. When the three-bet rate climbs above 14 percent with a low fold-to-four-bet number, the optimal response shifts toward a polarized four-bet range heavy on premium pairs and suited blockers.
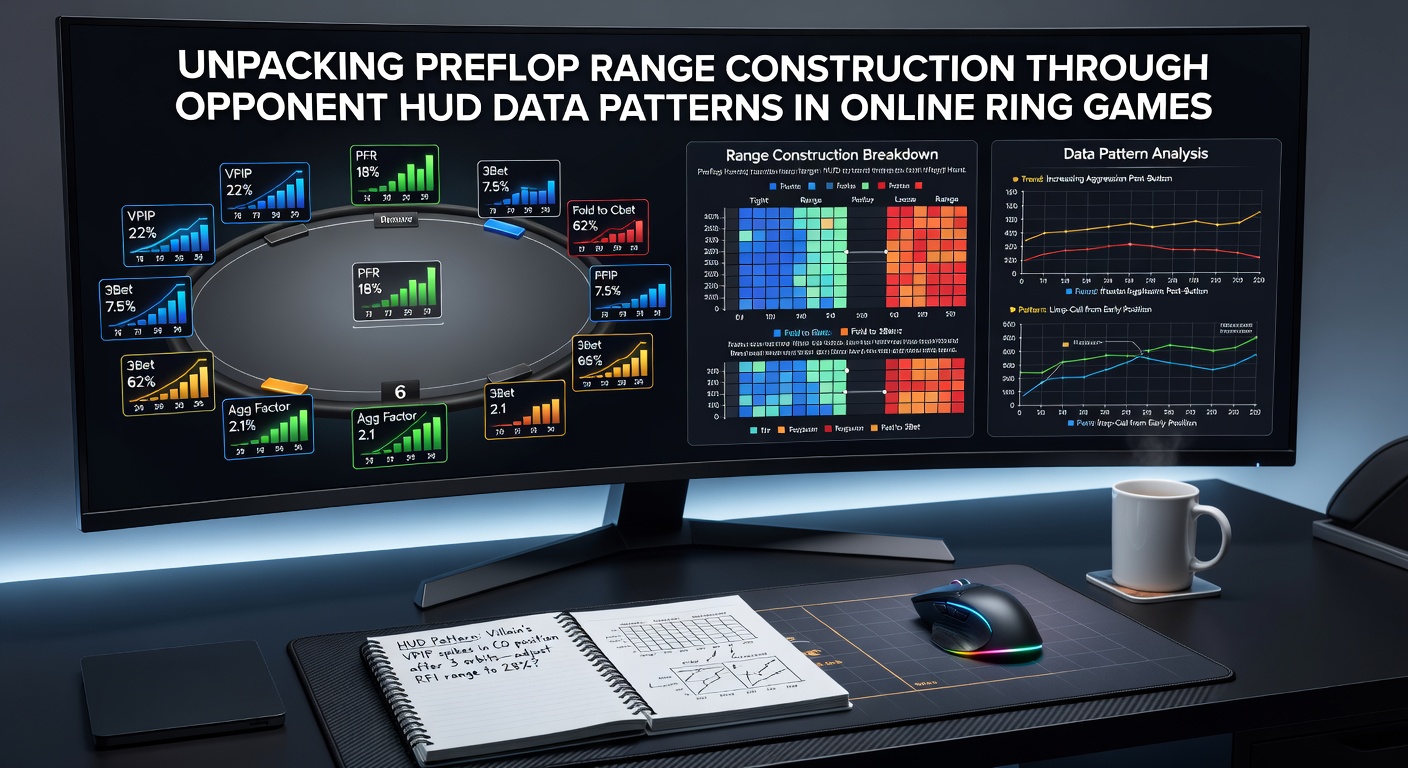
One documented case involved a regular whose fold-to-three-bet stat sat at 68 percent over twelve thousand hands. Opponents adjusted by three-betting a wider range that included suited aces and suited connectors while maintaining value bets with premium hands. The same dataset later revealed that four-bet frequencies stayed low, confirming that the polarized approach produced favorable fold equity without excessive risk.
Sample Size and Statistical Reliability
Small samples create misleading ranges because variance inflates or deflates early readings. Players therefore apply filters that require minimum hand counts before locking in range adjustments. Figures from industry reports compiled by the Canadian Gaming Association reveal that ranges based on fewer than three hundred hands carry error margins large enough to erase expected value edges in tight games.
Software updates released in early 2026 introduced confidence intervals alongside raw percentages, helping users judge when a stat has stabilized. Those intervals tighten faster in high-volume ring games where multiple tables run simultaneously, allowing quicker integration of reliable data into preflop planning.
Integrating HUD Insights with Table Dynamics
Dynamic adjustments occur when multiple opponents display complementary tendencies. A tight early-position opener combined with loose blinds creates opportunities to widen steal ranges while still respecting the early-position data. Conversely, a loose early-position range paired with aggressive three-bet stats from the blinds forces earlier tightening of opening ranges to preserve stack depth for post-flop confrontations.
Observers tracking session logs note that players who refresh HUD filters at the start of each orbit maintain more accurate range constructions than those who rely on lifetime aggregates. The difference becomes pronounced in games where recreational players rotate frequently and recreational tendencies shift the overall table texture.
Conclusion
Opponent HUD data supplies the raw material for constructing preflop ranges that reflect actual table conditions rather than generic charts. When metrics such as VPIP, PFR, and three-bet rates receive proper positional weighting and sufficient sample sizes, the resulting ranges support more precise decisions across opening, calling, and three-betting spots. Continued platform development through May 2026 has made these patterns easier to track and apply in real time.